 BFC Bulletins Monthly News Digest
Tags Data
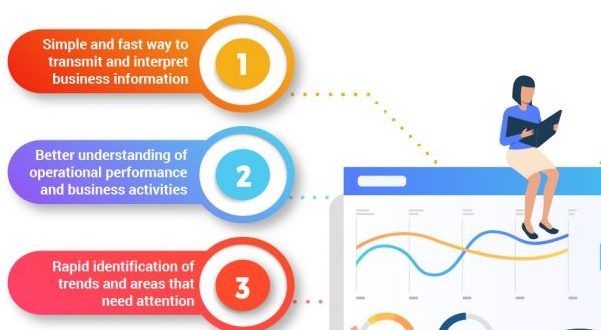
The ability to tell a story beyond numbers makes data visualization a powerful analytical tool. Data visualization can be used for a myriad of tasks, including analyzing trends, demonstrating performance, evaluating strategies and identifying patterns. The infographic below presents 10 compelling reasons why investments in data visualization is a smart idea.